Nov 12 | Better Wayfinding
Better Wayfinding, the easiest way to get from A to B even in spaces that don’t have sensors. It's free for qualified customers, can be set up in about 20 minutes, works on most touchscreens and modern browsers, and doesn't require any sensors to get started.
Who is it for?
Qualified customers with large enough spaces to benefit from a dedicated wayfinding solution
Key Features
- Tap to navigate
- Tap to search
- Automatic routing
Learn more at https://density.io/better-wayfinding and get in touch to see if you qualify.
Sep 3 | Density Live for Employees
Who is it for?
Workplace employees
Key Features
- Admin users can share a secure, employee-facing Live URL directly with employees. They can share this link (1) through their own internal website or internal communications channels or (2) by adding a QR code to existing Live displays that employees can scan.
- Each floor has a unique shareable URL that Admin users can access from a menu in the top right corner of Density Admin.
- Employees can access a shareable URL to view Live on a phone, tablet, or computer. After logging in with their company credentials, they can use Live to see real-time availability of meeting rooms and phone booths, as well as the busyness of shared amenities like cafes, kitchens, and break rooms.
Availability
- Live is currently available to clients who have OA installed.
- Employees do NOT need to have Atlas user logins. However, the client must have SSO enabled with Density before sharing out the link(s). For information on setting up SSO, see How to Setup Single Sign-On (SSO) with Atlas.
Help Article
July 12 | Creating and Managing Live Landmarks and Displays
Who is it for?
Density Live users responsible for the setup, rollout, and ongoing maintenance of Live displays.
What does it help them do?
Set up and manage Live displays.
Key Features
- Create and manage multiple Live displays and floor-level landmarks in the new Admin view
- See Live display location(s) on a floor plan and generate a unique URL per display. This URL can be used to render Live on a display screen via the device's browser with the correct floor plan orientation.
- Add optional preset landmarks to the floor plan (e.g., street (customizable), pin (customizable), elevator, stairs, kitchen, or restroom) and move or delete them.
- When adding a display for the first time, "Interactive setup mode" can be toggled on from the Edit Display popup to show a one-time menu for saving changes made to Live from a touch-screen display (e.g., pinching to zoom in/out, dragging the floor plan around the screen, etc.).
Help Articles
Managing Live Displays and Landmarks in Admin View
June 28 | Accessible Friendly Color Scheme (Color Blindness)
Who is it for?
All users of Atlas Live (requires Open Area sensors)
What does it help them do?
Improve visibility of when spaces are occupied and unoccupied
Key Features
Previous Red/Green has turned to Coral/Turquoise for a contrast-friendly theme
Mar 21 | Density Live: A real-time map of available spaces, built for employees.
Who is it for?
Designed for employees (building occupants) to:
- Instantly identify open spaces, whether for impromptu brainstorming or a quiet call.
- Integrate into your room booking system to show reserved rooms and let employees book directly through the app.
- Reclaim up to 28% of meeting slots by banishing ghost meetings, where meeting rooms are booked, but no one shows up.
Available to locations with Open Area sensors installed
Key Features
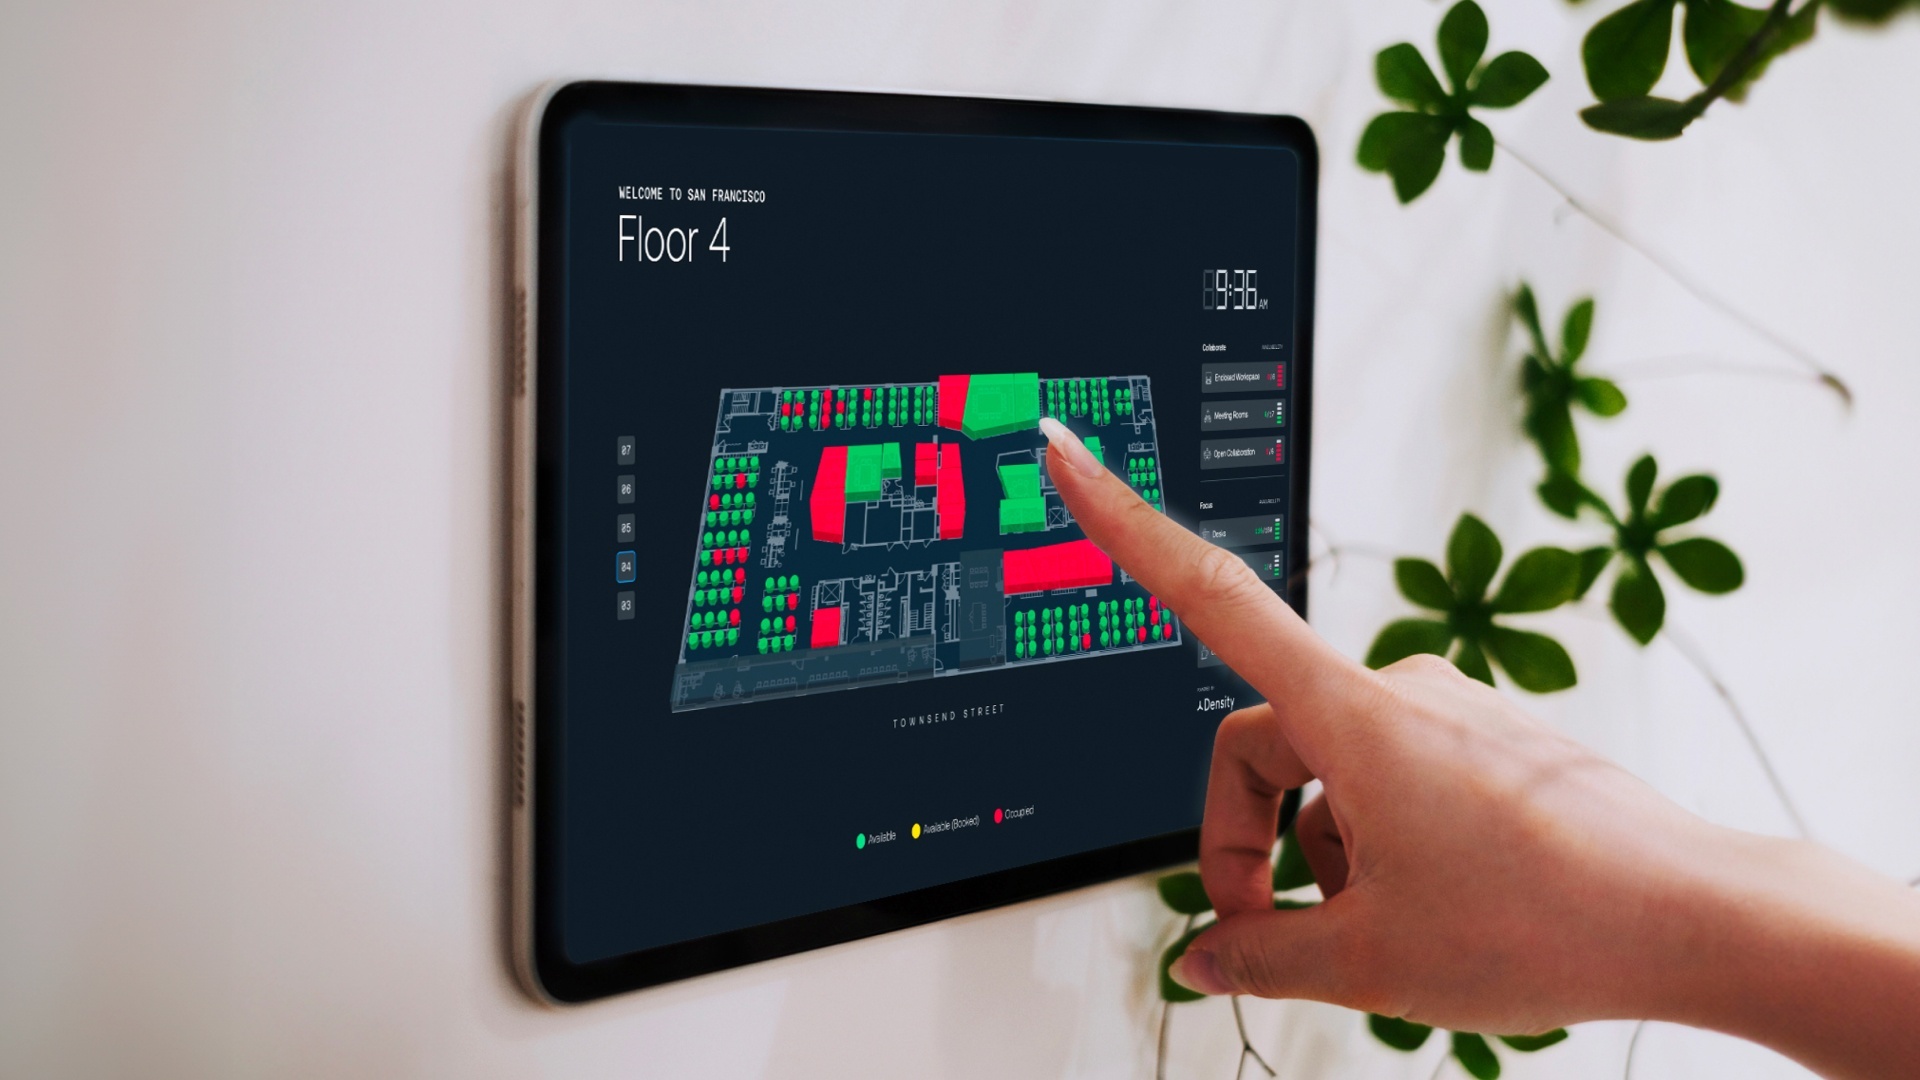
- Real-time space availability is shown on a floor plan: red = in use, yellow = booked, green = available
- Availability of API integrations with room booking systems like Microsoft Exchange, Google Workspace, or custom apps
- When integrated with room booking systems, Density Live shows in yellow spaces that are booked but not in use and lets employees book a room directly from the display
- Admin users can configure and save multiple displays with 2D, 3D views and landmarks (ex. elevator locations, street names) to help employees find their way more easily
- Admin users can see sensor locations on a floor plan so that you can easily see where they’re installed and see when any sensors go offline
Help Articles
Feb 21 | Density Analytics (a general purpose view in Atlas)
Who is it for?
Managers of spaces like cafes, gyms, stores, libraries, churches, and airport lounges who want a simpler and more flexible view in Atlas of how their space is performing.
Key Features
- Occupancy & Visits
- Simple reporting on occupancy (how many people are in the building) and visits (how many people entered the building).
Downloadable charts for busiest days of the week and hours of the day.
- Simple reporting on occupancy (how many people are in the building) and visits (how many people entered the building).
- Flexible Operating Hours
- Set and save operating hours that stay persisted.
- Use shortcut toggles for analysis of daytime vs. nighttime hours. Nighttime hours are ideal for spaces like nightclubs that are busiest outside of normal business hours.
- Preset & Custom Date Ranges
- Choose from a list of commonly used preset date ranges (ex. Last Week, Last 90 Days, Busiest Week).
- Set a custom date range to analyze with the visual calendar picker.
Help Articles:
Video: Guide to General Analytics
Quick Guide to General Analytics
-
February 14 | Preset & Custom Date Ranges in Building Analytics
Choose from a list of commonly used preset date ranges (ex. Last Week, Last 90 Days, Busiest Week).
Set a custom date range to analyze with the visual calendar picker.
Jan 29, 2024 | Comparison Charts in Building Analytics
- Space type charts (eg. Desk, Meeting Room, and heatmaps ) have a Compare action button in the bottom right.
- There are two types of comparison, floors and labels. Each type can be collapsed or expanded by clicking on the title within the menu:
Help Articles:
Quick Guide to Building Analytics
Jan 18, 2024 | Atlas Building Analytics
-
Building Analytics provides a centralized view of key analytics across your entire building or campus.
-
View the building summary which includes headcount, desk-sharing ratio (person(s) per desk), space mix, and operating hours.
-
Get visual answers to common occupancy planning questions like "Is the building running out of space?" and "What are the busiest hours of the day?"
-
Easily export graphical data into CSV or PNG files to share findings and include in presentations.
-
Default view is from the last 3 months
Help Articles:
Quick Guide to Building Analytics
Jan 5, 2024 | Sensor Status
- Toggle between space view or sensor health on your floorplan to see on and offline sensors, and health details
Help article: Sensor Status
Dec 20, 2023 | Bulk CSV Export
- Select and export multiple buildings and floors in the same export
- Update the operating hours, date range, and days of week directly in the "Download CSV" modal
- Export more than 3 months of data at a time
Help article: Atlas: Bulk CSV Export
We’ve updated the Atlas navigation experience to make it easier to navigate between floors/buildings
Entry spaces and visits (entrances/exits) are now available in Atlas
- View Entry space metrics (time used, peak occupancy, and visits) in Atlas
- View floor-level visits with Entry sensors
- Export entrances/exits as a CSV
- Show peak occupancy in the calendar (instead of average)
Users who try to log in to Atlas but don’t have an account can now “Request Access.” This will notify the Density team, who will reach out to account owners for permission.
We now have four roles in Atlas:
- Owner: Full edit rights for spaces and users. Full access to API development tools. Can provision and troubleshoot sensors.
- Admin: Can edit spaces they have access to. Can manage read-only users. Can’t access development tools, including API tokens.
- Editor: Can edit spaces they have access to
- Read-Only: Can only see data for spaces to which they’ve been assigned.
July 17, 2023 | Heatmaps
Users can now view hourly heatmaps when zoomed in on a week
See the help article Atlas: Heatmaps to learn how to use this new feature
Users can now:
- Share links to your current Atlas view (calendar filter, labels, etc)
- Add new users, manage user permissions, and export a user list
- Generate and manage API keys
- Set your units to meters squared instead of square feet
See help articles:
Where can I get an API access token?
How to add & manage users in Atlas
How to change your units of measurement
June 16, 2023 | Floor Level Entry Data and fast CSV Exports
All Density customers can now view their historical data (Entry or Open Area) in Atlas.- View floor-level occupancy trends for floors with Entry sensors
- Export data for all spaces in a building and peak and average building occupancy in one click
- CSV exports are 26.46x faster than before
See help article Atlas: CSV Data to learn how to use this new feature
June 9, 2023 | Cmd + Click/CTRL + Click to select spaces
You can now select a space, and CMD/CTRL + click to multi-select spaces. You can also CMD/CTRL + Click to remove spaces from a type or label filter report.
May 31, 2023 | Atlas 2.0 Release
- Floor occupancy trends
- Meeting room and desk charts
- 15-min data
See the help article Quick Guide to Atlas to learn how to use these new features
Comments
Please sign in to leave a comment.